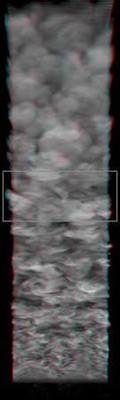
Stereoscopic Visualization of a Direct Numerical Simulation
Data courtesy J. Brasseur and P.K. Yeung, the Pennsylvania State University The flow is from bottom to top. The Reynolds number based on momentum thickness at the midpoint of the volume is 700. A passive scalar has been introduced into the flow along a spanwise line at the bottom of the picture. The spanwise scale has been expanded by a factor of 3 for clarity. This is the full computational domain of a direct numerical simulation of a developing turbulent boundary layer. The next stereogram is a closeup of the boxed region at the center of the picture, or you may return to the Stereoscopic Visualization menu.