Jeroen Tromp, Princeton's Blair Professor of Geology and a professor of geosciences and applied and computational mathematics, is using seismic wave data from earthquakes and the Titan supercomputer at Oak Ridge National Laboratory to create a 3-D model of the Earth underground, from the surface to a depth of about 1,800 miles.
Photo by Denise Applewhite, Office of Communications
When a 7.9-magnitude earthquake struck central China's Sichuan province in 2008, seismic waves rippled through the region, toppling apartment houses in the city of Chengdu and swaying office buildings 1,000 miles away in Shanghai.
Though destructive, earthquakes provide benefit in one respect: they help researchers learn about the structure of the Earth, which in turn could lead to more accurate predictions of damage from future quakes and volcanic activity. By eavesdropping on the seismic vibrations of quakes as they rumble through the Earth, researchers can detect the existence of structures such as mineral deposits, subterranean lakes, and upwellings of magma. Thanks to a growing earthquake detection network and superfast computers, geoscientists are now able to explore the Earth's interior, a region that has been more inaccessible than the deepest ocean or the farthest planet in our solar system.
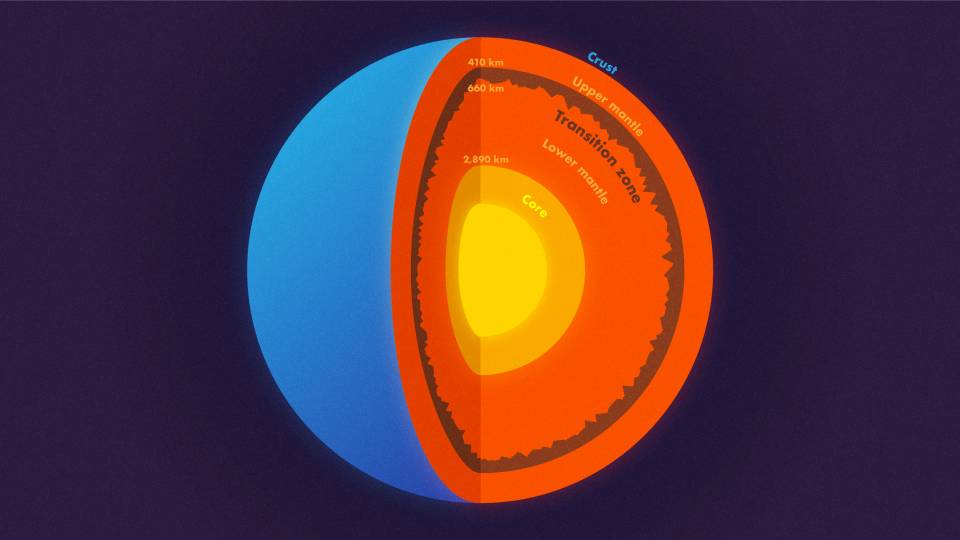
Princeton geosciences professor Jeroen Tromp and his team have embarked on an ambitious project to use earthquakes to map the Earth's entire mantle, the semisolid rock that stretches to a depth of 1,800 miles, about halfway down to the planet's center and about 300 times deeper than humans have drilled. For the task, his team will use one of the world's fastest supercomputers, Titan, which can perform more than 20 quadrillion calculations per second and is located at the Department of Energy's Oak Ridge National Laboratory in Tennessee.
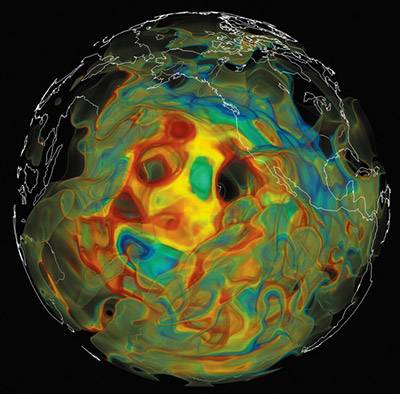
Computer simulations use the speed of seismic waves from earthquakes to reveal the existence of subterranean structures. In this view of the mantle below the Pacific Ocean, slower waves are shown in red and orange while faster waves are shown in green and blue. The faster waves are associated with subduction zones where one tectonic plate sinks underneath another plate. (Image courtesy of Ebru Bozdağ, University of Nice Sophia Antipolis, and David Pugmire, Oak Ridge National Laboratory)
"Seismology is changing at a fundamental level due to advances in computing power," said Tromp, who earned his Ph.D. in geology from Princeton and is Princeton's Blair Professor of Geology, professor of applied and computational mathematics, and associate director of the Princeton Institute for Computational Science and Engineering. "If someone had told me what seismology would look like 20 years from when I graduated from Princeton in 1992, I would have never believed it."
For the project, Tromp will use seismic waves from roughly 3,000 quakes of magnitude 5.5 and greater, recorded at thousands of seismographic stations worldwide and distributed via the National Science Foundation's Incorporated Research Institutions for Seismology. These stations make recordings, or seismograms, that detail the movement produced by seismic waves, which typically travel at speeds of several miles per second and last several minutes.
"The ultimate goal is a 3-D map on a global scale," said Tromp, who expects to have preliminary results at the end of this year. "We are specifically interested in the structure of mantle upwellings and plumes," he said, "but much of it will be investigating the images for unusual features."
These unusual features could include, for example, a fragment of a tectonic plate that broke off and sank into the mantle. The resulting map could tell seismologists more about the precise locations of underlying tectonic plates, which can trigger earthquakes when they shift or slide against each other. The maps could also reveal the locations of magma that, if it comes to the surface, causes volcanic activity.
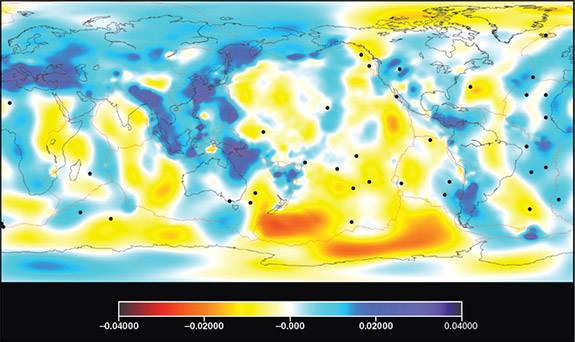
This map shows relative variations in seismic shear wave speed at a depth of 389 kilometers (241 miles). Blue colors denote faster than average wave speeds, and red colors denote slower than average wave speeds. (Image courtesy of Ebru Bozdağ, University of Nice Sophia Antipolis, and David Pugmire, Oak Ridge National Laboratory)
As seismic waves travel, they slow or speed up depending on the density, temperature and type of rock. For example, they slow down when traveling through an underground aquifer or magma. By combining seismograms from many earthquakes recorded at many stations, geologists can produce a three-dimensional model of the structure under the Earth's surface.
This technique is called seismic tomography and is analogous to computerized tomography used in medical ("CAT") scans, in which a scanner captures a series of X-ray images from different viewpoints, creating cross-sectional images that can be combined into 3-D images.
Over the past eight years, Tromp has been at the forefront of research on how to improve seismic tomography to obtain high-definition, accurate images of the Earth's interior. Past approaches for making these images incorporate only three types of seismic waves: primary or compressional waves, secondary or shear waves, and surface waves. Tromp has pioneered techniques for using much more of the information in seismograms, utilizing both waves that travel from the quake epicenter to the detector as well as those that travel from the detector to the quake, which are called adjoint waves.
"If we are going to do better, we need to use everything in the picture, in other words, everything and anything in the seismograms," Tromp said.
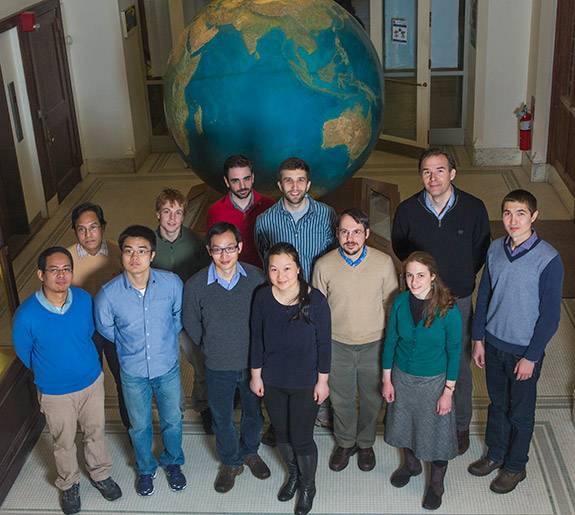
The Princeton research team includes (back row, left to right): postdoctoral research associate Heru Rusmanugroho, graduate student James Smith, postdoctoral research associate Matthieu Lefebvre, graduate student Ryan Modrak, Professor Jeroen Tromp, postdoctoral research associate Dmitry Borisov and (front row, left to right), associate research scholar Hom Nath Gharti, graduate student Wenjie Lei, postdoctoral research associate Youyi Ruan, graduate student Yanhua Yuan, senior Linux administrator/software and programming analyst David Luet, and graduate student Leah Langer. (Photo by Denise Applewhite, Office of Communications)
Tromp's team feeds data from seismograms into a computer model, which simulates each wave as it propagates from the epicenter. The resulting "synthetic seismograms" are compared to real seismograms, and the differences are fed back into the model to improve it. The researchers do this over and over, comparing data with simulations and extracting differences. With each pass, they improve their model.
Before attempting to map the entire Earth, Tromp and his team, with funding from the National Science Foundation, showed that their technique worked in smaller regions, first in Southern California using data from 143 quakes, which was published in the journal Science in 2009, and later in Europe using 190 quakes. The Europe study, published in the journals Nature Geosciences in 2012 and Science in 2013, included work by then graduate student Hejun Zhu, now a postdoctoral researcher at the University of Texas-Austin; postdoctoral researcher Ebru Bozdağ, now an assistant professor at the University of Nice Sophia Antipolis; postdoctoral researcher Daniel Peter, who today is a senior scientist at ETH Zurich; and David Pugmire, a visualization scientist at the Oak Ridge Leadership Computing Facility (OLCF).
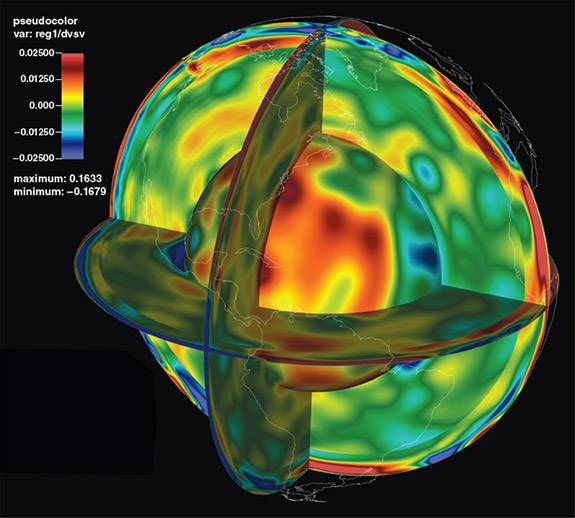
Using a technique that is similar to a medical CT ("CAT") scan, researchers at Princeton are using seismic waves from earthquakes to create images of the Earth's subterranean structures — such as tectonic plates, magma reservoirs and mineral deposits — which will help better understand how earthquakes and volcanoes occur. The team is using the Titan supercomputer at the U.S. Department of Energy's Oak Ridge National Laboratory in Tennessee to map the entire mantle, creating a three-dimensional map of the Earth to a depth of 1,800 miles below the surface. (Image courtesy of Ebru Bozdağ, University of Nice Sophia Antipolis, and David Pugmire, Oak Ridge National Laboratory)
More recently, Tromp and collaborators published a study on the structure of the Earth beneath East Asia using 227 quakes, including the 2008 quake in Sichuan. The study, accepted for publication in the Journal of Geophysical Research: Solid Earth and conducted with colleagues at Rice University, the University of Toronto, the China University of Petroleum and the China Earthquake Administration, plumbed East Asia to a depth of 560 miles.
These smaller projects enabled Tromp's team to compete for and obtain 50 million processor hours on Titan this year as part of a prestigious 2015 Innovative and Novel Computational Impact of Theory and Experiment (INCITE) award from the U.S. Department of Energy.
One of the major challenges for Tromp's team was to figure out how to compare real data to modeled results, which are given in the language of the computer code that created them. "You need to bring the data and the simulation into the same framework, to put them on equal footing," Tromp said. "Then you can start to compare real data to the simulations and extract differences."
Nor is Titan easy to program given its unique architecture — it is supercharged with graphics processors originally developed for gaming systems. "The challenge is to get the data onto the graphics cards and get the cards to do the right thing with the data," Tromp said.
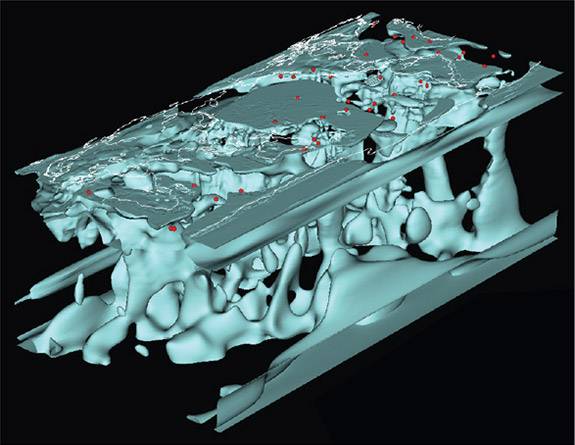
This three-dimensional image displays contours of locations where seismic wave speeds are faster than average. (Image courtesy of Ebru Bozdağ, University of Nice Sophia Antipolis, and David Pugmire, Oak Ridge National Laboratory)
For postdoctoral researcher Matthieu Lefebvre, who earned a Ph.D. in mathematics prior to coming to Princeton, working on the project was an opportunity to work with one of the most powerful computers on the planet. "The project offers a lot of opportunities and challenges, such as how to optimize computational algorithms and workflows at large scales," Lefebvre said.
For help, Tromp relies on the OLCF's "science liaisons," experts in mathematics and computer science such as Judith Hill who work with university scientists to prepare code for Titan.
"The team's seismographic data originally were laid out in such a way that a significant fraction of the simulation time would be spent reading the data off the disks," Hill said. "Professor Tromp worked with our data liaisons to develop a new data format for the seismic community that was optimal for large-scale computers such as Titan and the file systems that go along with them."
The OLCF is also helping the Princeton team with the task of visualizing the results of the calculations. "Once you run the models, you have to mine the images to see what you have," Tromp explained. "You need techniques like volume rendering and feature extraction to show you what you have discovered. For example, you might discover a new plume, an upwelling of magma that traverses the mantle, or you might discover hot spots."
Added Tromp: "You don't know what it is you are looking for, you are hunting. That is the real challenge, and that is the wonderful part of this project — waiting to see what we will discover."
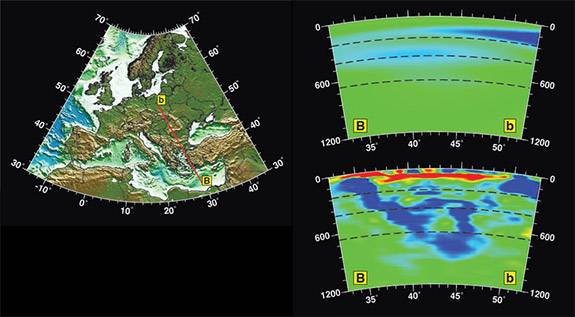
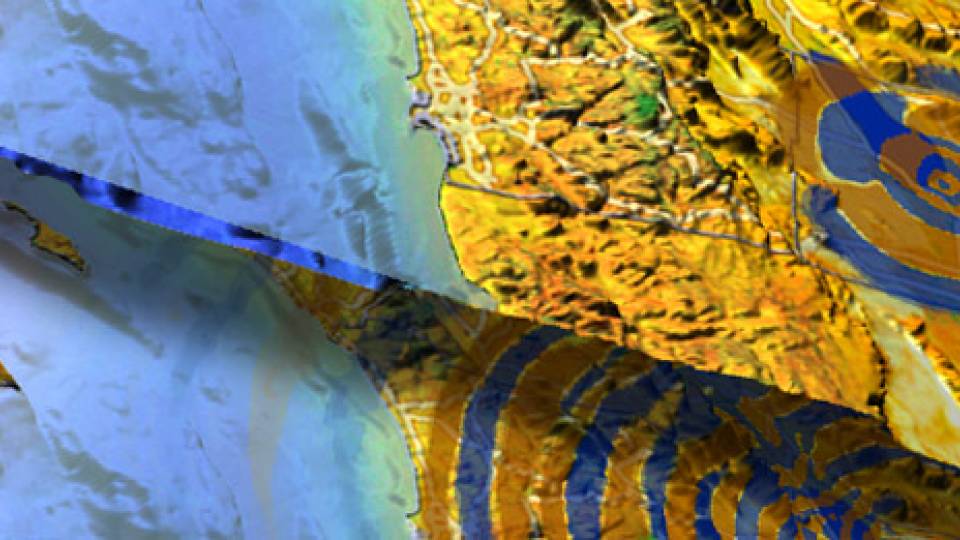
Princeton researchers convert seismic wave information collected from real earthquakes into images of the structures underneath the Earth's surface. The two panels on the right show a 1,200-kilometer (746 miles) deep slice of the Earth taken from points B to b in Europe as shown in the left panel. A computer program designed by Tromp and his team compares real earthquake data to a computer-generated model, then uses any discrepancies to improve the model. After 30 such iterations, the computer simulation revealed that a fragment of a tectonic plate (in blue) is sinking beneath Greece and Bulgaria (lower right panel). (Image courtesy of Hejun Zhu, University of Texas-Austin)