Color Patterns of an Iron Extraction Time Series
Andrew Altevogt
Department of Civil and Environmental Engineering
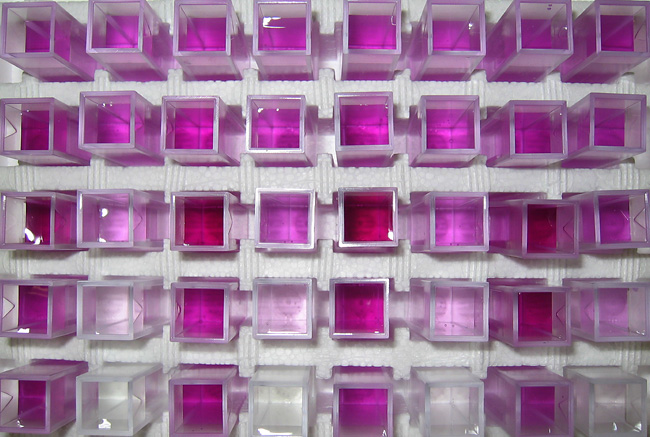
Hydrochloric acid flows in a closed loop through a column packed with a synthetic iron oxide coated sand. As the acid contacts the sand it extracts Fe(III) from the sand. The iron in solution causes the ferozine to turn shades of pink/purple (darker shades indicate higher iron concentrations). A spectrophotometer measures the absorbance of a specific wavelength of light for each sample which is then correlated to iron concentrations. Going from left to right and from top to bottom are a time series of samples taken from the initial time until the equilibrium time when all iron has been desorbed. Each set of two samples (left to right) are the outflow (initially pink) and inflow (initially clear) from the column. The outflow samples start relatively high (pink) become higher (more purple) and then gradually become lighter (pink) again. The inflow samples start out clear and gradually become darker (pink) throughout the experiment. The difference between each pair of inflow and outflow colors is a representation of the iron extraction rate. The extraction rate is high (clear inflow versus pink/purple outflow) at early times and goes to zero, when all of the iron has been extracted, at the end of the experiment (solutions are the same shade of pink). The color patterns which arise are simply a manifestation of dynamic changes in iron extraction.
|