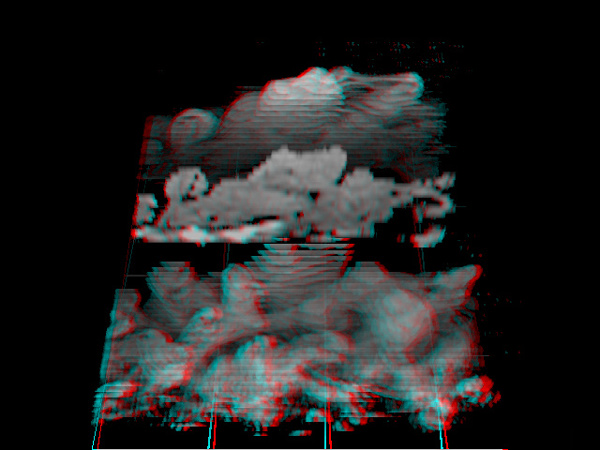
Split view of the coherent structure
Flow is left to right. The volume has been split, spread apart, and a z-normal slice through the middle of the structure is displayed. Note the bright filament of fluid in the process of lifting away from the floor. The full volume containing this structure can be seen in the top view. This is the final stereogram for the experimental boundary layer. Continue on to see some visualizations of a numerical simulation of a boundary layer. There are some additional stereograms which can be viewed. There is also information available on how the volumetric data set was acquired, and how the stereograms were generated.