|
|
|
||||||||||||||
| Failure Mechanisms | ||||||||||||||||
| Creep
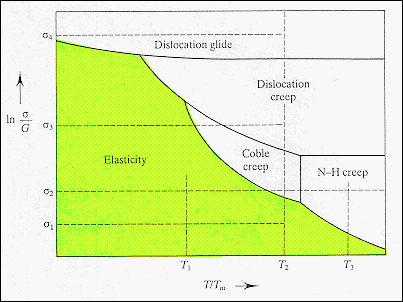
Diagrams
· The
diagram represents the stress-temperature behavior of a material and shows
the mechanisms controlling creep deformation
in various (σ T
) regions.
|
 |
|||||||||||||||
| From:
Courtney, "Mechanical Behavior of Materials,"
McGraw Hill (1990) |
||||||||||||||||
| · The stress range upper limit, σ4, is 0.1G, the "theoretical" material strength. | ||||||||||||||||