Reshaping files from
the World Development Indicators and datasets with similar format
If you
do not see the menu on the left click here to see it
Preparing the data (click here to get it)
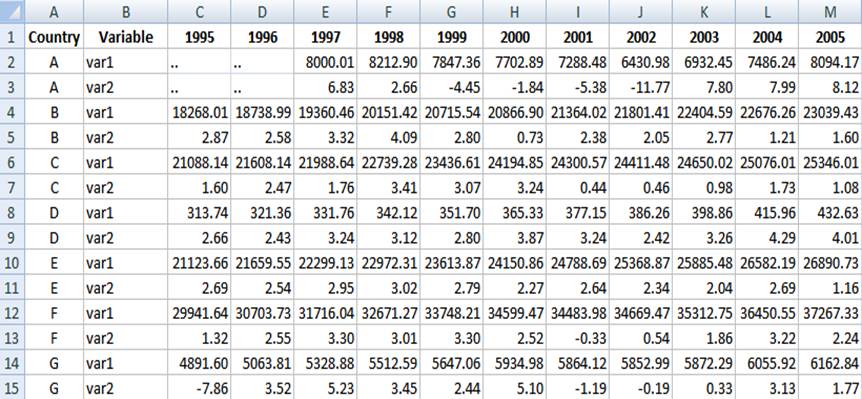
Before putting this data in Stata
you need to do some editing. First,
you need to add a character to the column headings. Stata
does not take numbers as variable names. In this case we add an “x” to the
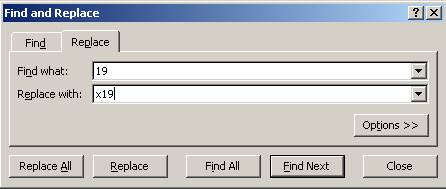
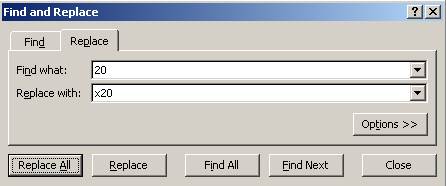
years. In excel you do this by using the ‘replace’ function. For the 1900s we
replace “19” for “x19”, same for the 2000s. See the following
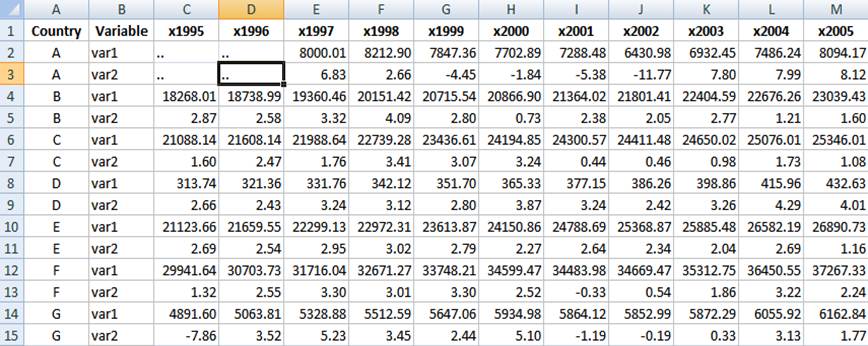
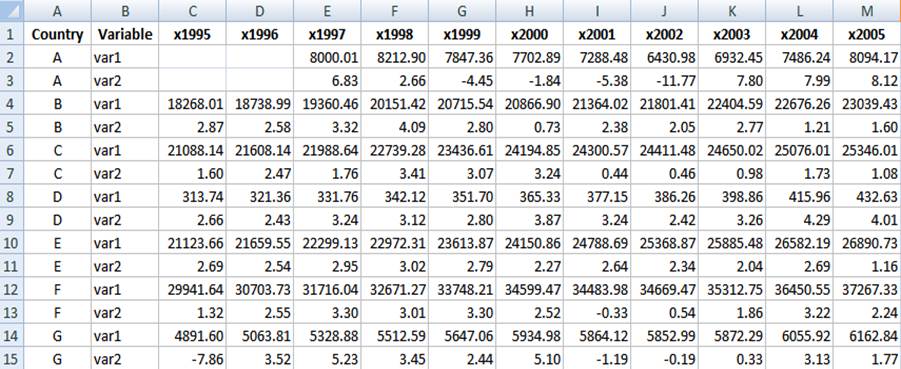
So we
have something like this
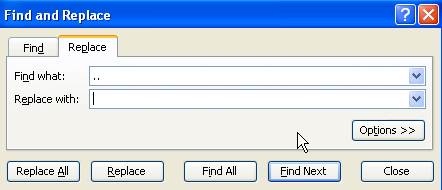
Replace
the dots “..” (or any string
character) with a blank
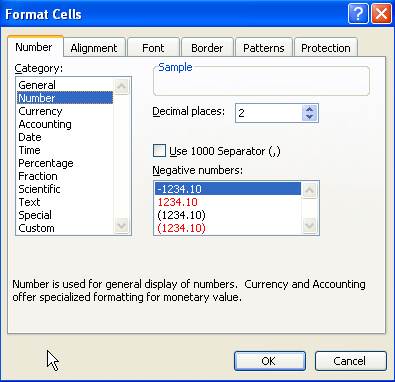
Make
sure the numbers are numbers. Go to Format - Cells and select “Number” in the
“Number” tab and click OK. This will format the data as numeric with two
decimals
The
table should look like:
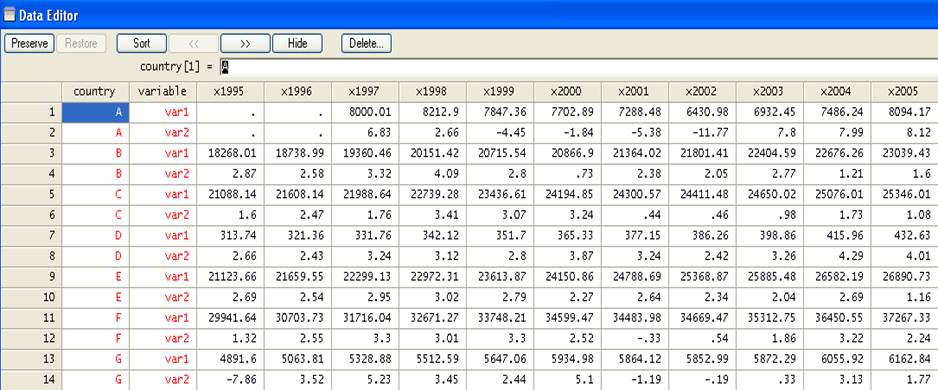
Now
select the whole data set, press Ctrl-C, go to the Stata’s
data editor and
press Ctrl-V to paste the data, you should have the following:
Another
alternative is to save the file as *.csv format. We
will save here as GDPTest.csv
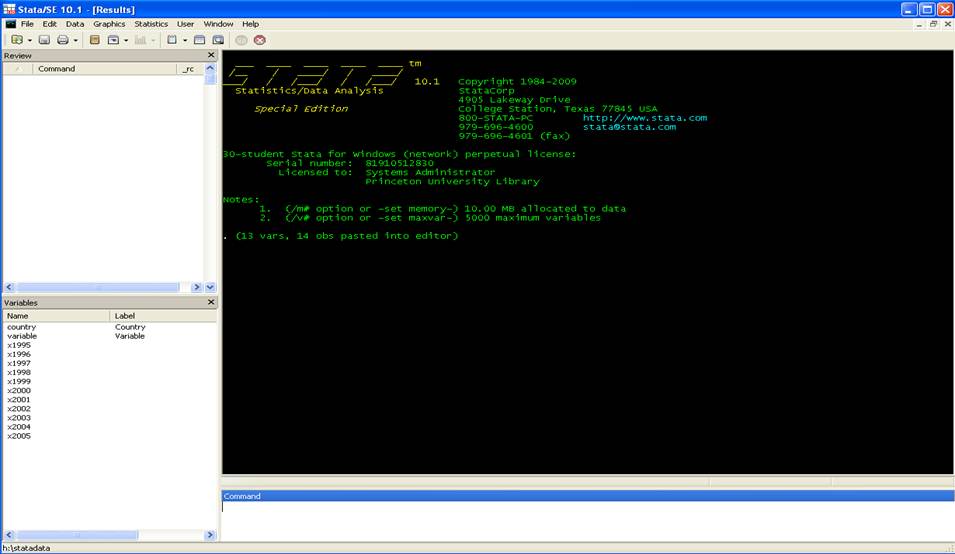
Open Stata and type in the command window
insheet using gdptest.csv
The Stata screen should look like this
Reshaping wide to long
In wide
to long from
|
id |
x2001 |
x2002 |
x2003 |
|
1 |
2 |
7 |
1 |
|
2 |
3 |
5 |
9 |
|
3 |
1 |
1 |
8 |
To this
you type:
reshape long x, i(id) j(year)
|
id |
year |
x |
|
1 |
2001 |
2 |
|
1 |
2002 |
7 |
|
1 |
2003 |
1 |
|
2 |
2001 |
3 |
|
2 |
2002 |
5 |
|
2 |
2003 |
9 |
|
3 |
2001 |
1 |
|
3 |
2002 |
1 |
|
3 |
2003 |
8 |
First
create a unique identifier for each row of data. Type:
gen id = _n
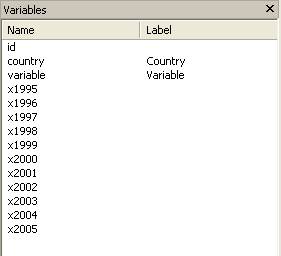
Years
are organized by columns and variables as observations which are not suitable
for time series analysis or other type of analysis. We need to put it in a way
where each year represents an observation (row) and each column has a variable.
Type:
reshape long x, i(id) j(year)
Where:
- long – Goes from wide to long format.
- x – The variables
with the prefix “x” (x1960, x1961, x1962, etc.) are to be converted from
wide to long.
- i(id) – A unique identifier for the wide format
is in variable “id”.
- j(year) – Indicates that the suffix of “x” (x1961,
x1962, x1963, …), the years, should be put in variable called “year”.
NOTE: If you have more
than one variable you can list them as follows:
reshape long x y
z, i(id) j(year)
If you
browse your data, it should look like this, variable “x” has all the values for
both var1 and var2.
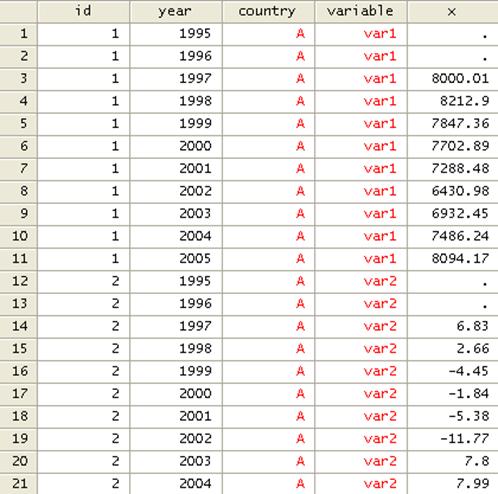
To separate var1 and var2 we need to do a little bit of
work.
First we need to create a new variable with the labels of
each variable, type
encode variable, gen(varlabel)
Create a do-file with the labels for each variable. This
comes in handy when dealing with a lot of variables.
label save varlabel using varname, replace
You
will notice that varname.do is created.
![]()
Using
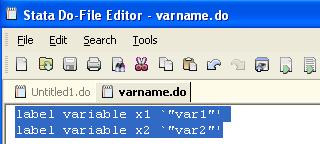
notepad or the do-file editor within Stata open varname.do. Using the do-file editor this is what you
will see
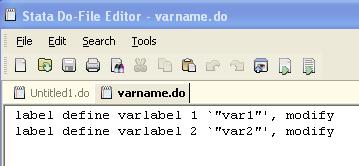
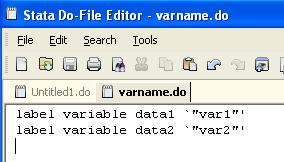
Do the
following changes:
1.
Change
“label define” to “label variable”
2.
Change
“varlabel 1” to “x1” and “varlabel
2” to “x2”
3.
Delete
“, modify”
4.
Save
the do-file.
Separating two stacked variables
You
need to create an id variable to identify the groups. The combination of egen and group creates an id
variable for the two time series within each group (‘var1’ and ‘var2’). Type
egen id2 = group(country year)
move id2 year
drop id
drop variable
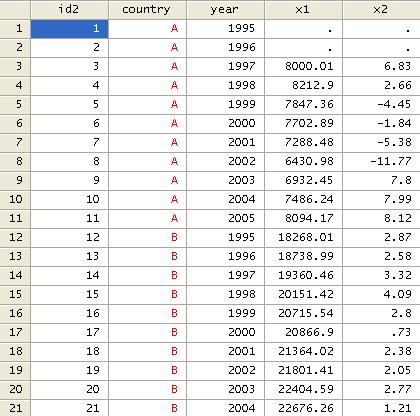
To
reshape long to wide you should have a table that
looks like the following where one variable holds two different variables per
country. Each country has two variables from 1960 to 2006.
Now
let’s reshape from long to wide because we want our variables to have one
column each. Type
reshape wide x, i(id2) j(varlabel)
Where:
- wide – Goes from long to wide format.
- x – The variable of interest to go from long to
wide is called “data”.
- i(id) – A unique identifier for the wide format
is in variable “id”.
- j(varlabel) – Indicates that
the suffix of “data” has to be taken from “”varlabel”
(“varlabel” has two categories: 1 –var1- and 2
–var2).
NOTE: If “j” is not
available in your dataset, you may be able to generate one using the following
command:
bysort id: gen jvar=_n
Then
reshape
reshape wide data, i(id) j(jvar)
Run the do-file varname.do by selecting all and clicking
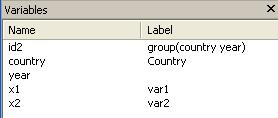
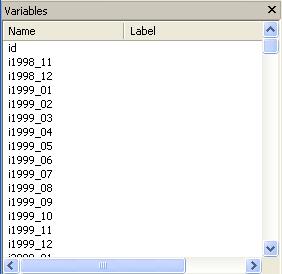
on the last icon, this will change the labels for x1 and x2
![]()
The variable window should look like
The final dataset should look like
Reshaping long to wide
In long
to wide we go from
|
id |
time |
r |
|
1 |
1 |
2 |
|
1 |
2 |
7 |
|
1 |
3 |
1 |
|
2 |
1 |
3 |
|
2 |
2 |
5 |
|
2 |
3 |
9 |
|
3 |
1 |
1 |
|
3 |
2 |
1 |
|
3 |
3 |
8 |
To this
|
id |
r.time1 |
r.time2 |
r.time3 |
|
1 |
2 |
7 |
1 |
|
2 |
3 |
5 |
9 |
|
3 |
1 |
1 |
8 |
For the example above you tipe:
reshape wide r, i(id) j(time)
Here is a more complex example.
Let’s use the following dataset (click
here to get it)
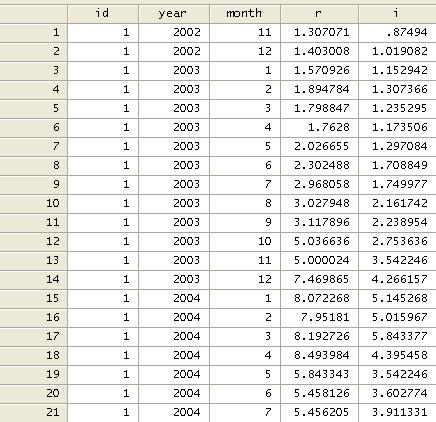
Where “r” is return rate and “i” is interest
rate.
IN THIS EXAMPLE WE NEED TO WORK ON THE DATE VARIABLE
FIRST. IF YOU DO NOT HAVE THIS YOU CAN SKIP THIS PART.
Notice that time is
separated in years and months (monthly data). We need to combine them into one
date variable. Since they are numeric variables we need to put them together as
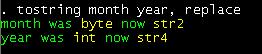
string variables. We convert them to string first and then we concatenate them.
Type
tostring month year, replace
We then
concatenate them. Type
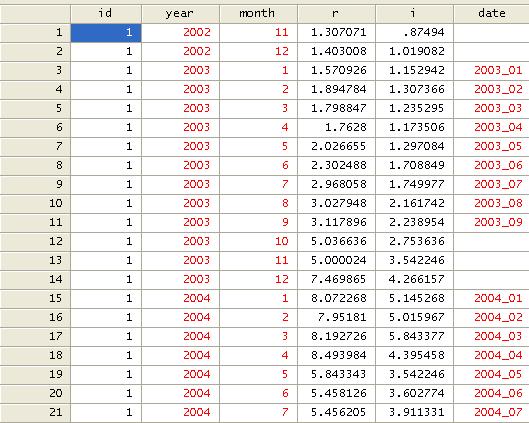
gen date=year+"_0"+month if
length(month)==1
![]()
This will
create the date variable for dates with months 1 to 9 (with “0” before to make
it double digit), see below
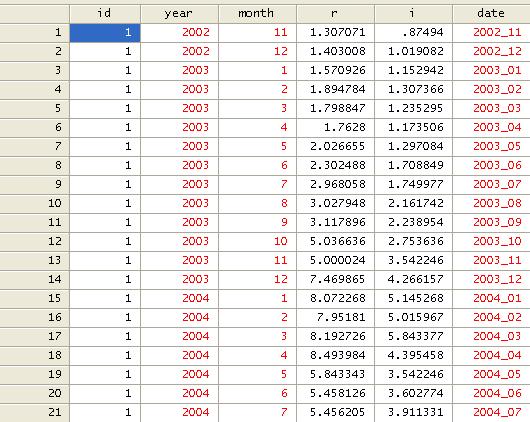
Now we
add the rest. Type
replace
date=year+"_"+month if date==""
![]()
We can
drop ‘year’ and ‘month’.
drop
year month
Let’s
put some order, type
order id date
RESHAPING
WIDE TO LONG
Now,
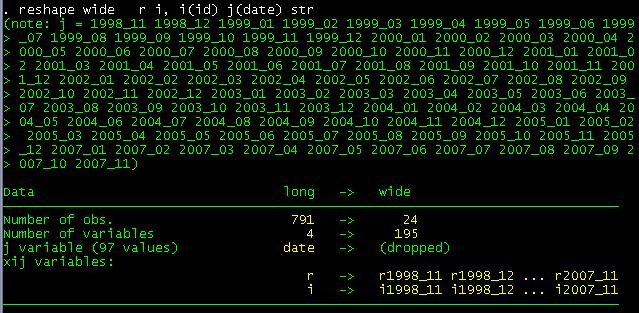
let’s reshape. Type
reshape wide r i, i(id) j(date) str
We add
‘str’ because ‘date’ is a string variable.
Where:
- wide – Indicates the type of reshape, in this
case from long to wide format.
- r i – The
variables of interest from long to wide are “r” and “i” (prefix for the new
variables).
- i(id) – A unique identifier for the wide format
is in variable “id”.
- j(date) – Indicates the suffix of “r” and “i” taken from ”date” (notice “xij” variables:” above)
The
variable window should look like
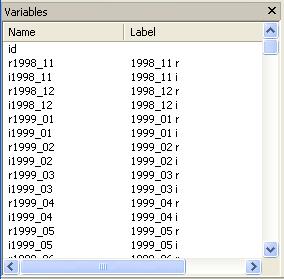
And the
data is now in the following format:
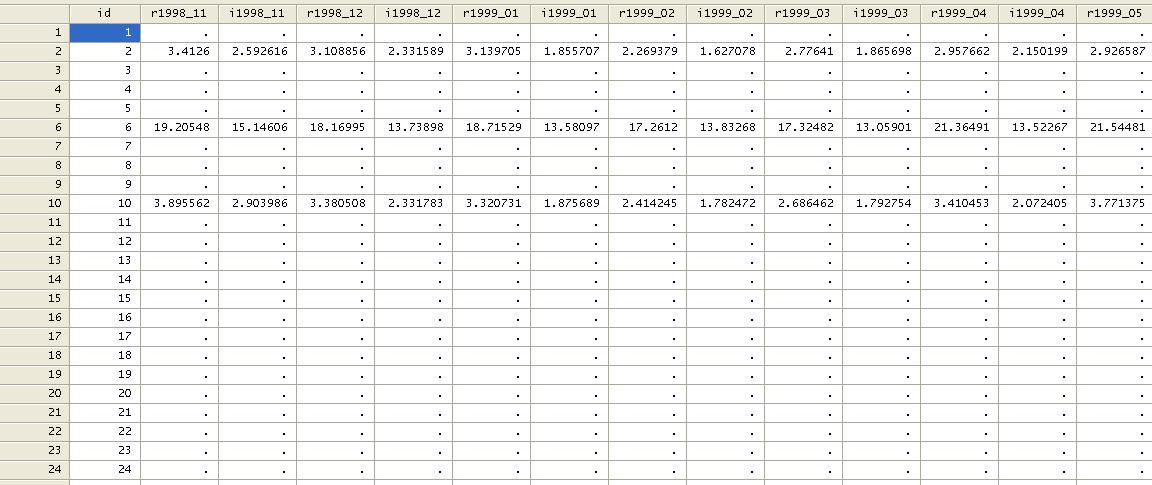
NOTICE
ABOVE ‘RETURNS’ AND ‘INTEREST RATES’ ARE TOGETHER FOR THE SAME TIME PERIOD. IF YOU
WANT TO HAVE ALL ‘RETURNS’ AND ‘INTEREST RATES’ TOGETHER YOU NEED TO DO THE
FOLLOWING:
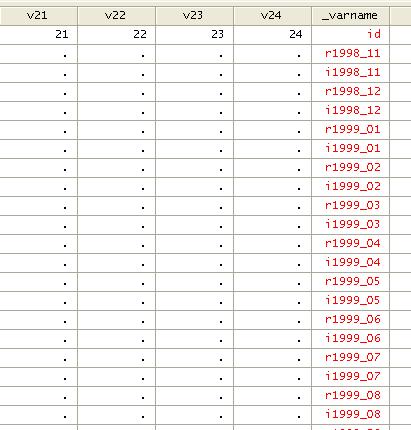
We need
to transpose the data as follows
xpose,
clear varname
The
data will be transposed with an additional variable “_varname”
(option varname after comma)
We then
sort by _varname
sort
_varname
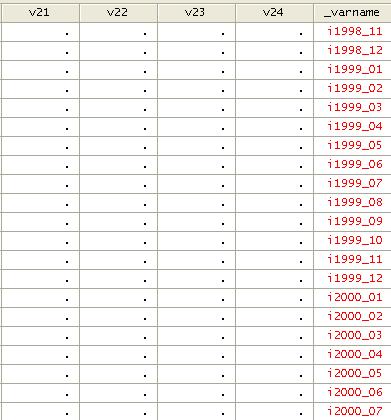
And
transpose again as follows:
xpose, clear
Move
“id” to the top
order id
You can
export the data all together or by subsets. Let’s export in two files, one for
returns and another for interest.
The
following will export the return data into a *.csv
file (readable in excel)
outsheet id r* using testr.csv, comma replace
Now the
interest data
outsheet i* using testr.csv, comma replace
You can
open these two files in excel.
Noticed
the name of the files and beware of the path. The format above will save the
files in the current active directory.
To specify a path you will need to put it in quotation like
outsheet id r* using “H:\mydata\testr.csv”, comma
replace
Some
useful links:
http://www.ats.ucla.edu/stat/stata/notes/reshape.htm
http://www.ats.ucla.edu/stat/stata/modules/reshapel.htm
http://www.ats.ucla.edu/STAT/stata/modules/reshapew.htm
For
more details on this command type
help reshape