If you do not see the menu on the left click here to see it
The Do-file
[IMPORTANT: Try not to copy and paste
the programs, write them yourself. Two reasons: learning experience and pasting
programs may not work properly (lots of issues with quotation marks)]
Do-files are
ASCII files containing a series of Stata commands (which could include
programs).
These type of
files are just plain-text with the extension *.do.
You can use
notepad, wordpad or any word processor to write
do-files.
You can also
use the built-in do-file editor in Stata.
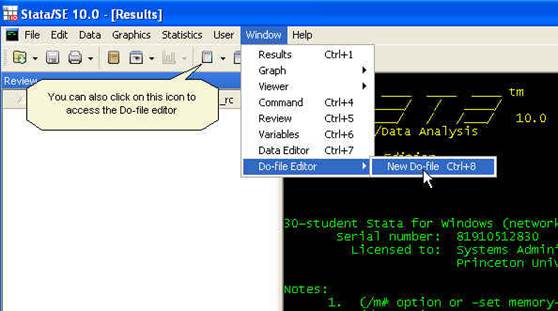
You can also
type in the command window:
doedit
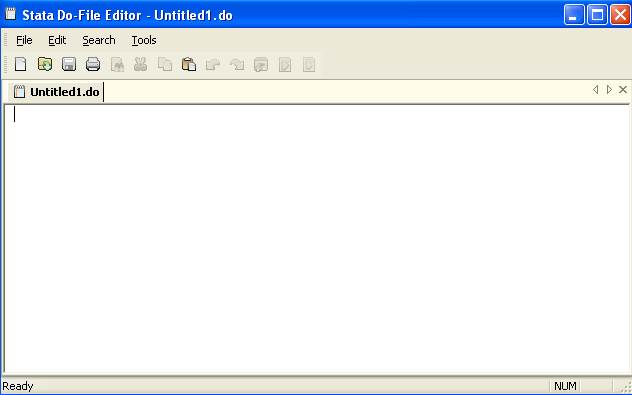
Stata do-file
editor window will pop-up[1].
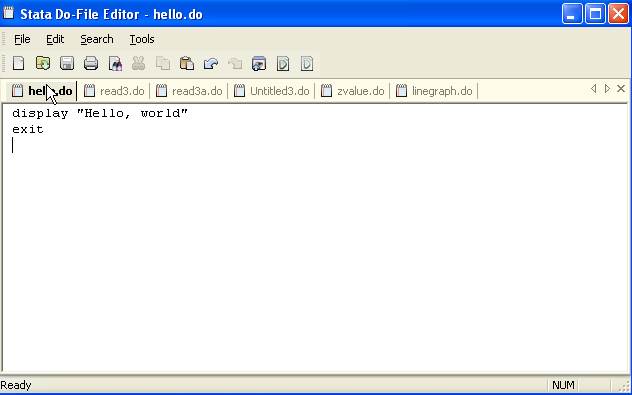
As tradition
dictates, all programming courses start with the “Hello, world” example. In the Stata
do-editor write the following:
[IMPORTANT: At the end of each line hit enter]
DO-FILE:
hello.do
display
"Hello, world"
exit
NOTE: YOU MAY
HAVE TO RETYPE THE SINGLE AND DOUBLE QUOTES WHEN COPYING THE DO-FILES CODES
INTO STATA
Go to
File->Save and save it as hello.do (use whatever name you want just make sure to save it
with extension *.do).
[IMPORTANT 1: Remember to change the
path to your working directory: cd “h:\statadata\”,
save the do-file there.]
[IMPORTANT 2: If you copy and paste the
code be careful with quotations, you may have to retype them into Stata
otherwise they program or do-file may not run]
Once saved,
go back to the command window type
do
hello[2]
Or, you can also run the do-file
from the do-file editor by clicking on the right arrow

And you will
get the following output.
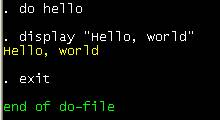
Stata
recognizes the file hello.do by typing only “hello” (as long as
you are in the working directory, otherwise you will have to specify the path
of the do-file)
The display
command does more than just text; it is also a hand calculator, type
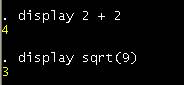
For further
details on this type help display
You can also
write programs directly in Stata, in the command window type
program
hello
1. display
“Hello, world”
2. end
NOTE: YOU MAY
HAVE TO RETYPE THE SINGLE AND DOUBLE QUOTES WHEN COPYING THE DO-FILES CODES
INTO STATA
To execute it
just type
. hello
Hello, world
The
main problem with
programs is that they last as long as Stata is active. To make them permanent
you can write a program in a do-file. If you type doedit again in the command window a new do-file editor page
will appear, type in the do-editor
DO-FILE:
hello1.do
program
hello
display
“Hello, world”
end
exit
NOTE: YOU MAY
HAVE TO RETYPE THE SINGLE AND DOUBLE QUOTES WHEN COPYING THE DO-FILES CODES
INTO STATA
And save it
as hello1.do
Back to
Stata, if when you type do hello get the following error message:
do
hello
program
hello
hello
already defined
r(110);
end of
do-file
r(110);
This happens
because a hello program already exists; you need to
delete the previous hello program, type
program
drop hello
Type do hello1 again, this is what you will see on the results window
do
hello /*You type this*/
program
hello /*This is what you’ll
see*/
1. display
"Hello, world"
2. end
exit
end of
do-file
To see if it
works type hello and you should get:
. hello /*You type this*/
Hello, world
You can put
all together in one do-file
DO-FILE:
hello1.do [modified]
capture
program drop hello
program hello
display
"Hello, world"
end
hello
exit
NOTE: YOU MAY
HAVE TO RETYPE THE SINGLE AND DOUBLE QUOTES WHEN COPYING THE DO-FILES CODES
INTO STATA
Notice the
new command capture, if there is no program called hello
the do-file will not run, capture will ignore the error and let the whole
program run (use this feature only when error are an annoyance in testing
programs). For more details on this type help capture.
Now
let’s use some of the
examples from the previous sections to write a do-file that does the following:
- Starts a log (to keep track of
your work)
- Reads data
- Describes data
- Save data
- Close the log
Go to the
do-file editor and type
DO-FILE:
read1.do
capture log
close /* In case no log is open */
log using
log1.log, append /* Start a log, you can append or replace an
existing log */
clear /*
Reset memory, remove active data */
infile using lat544 /*
Read ASCII data using dictionary lat544 */
describe /*
Get general info on your data */
save
lat544, replace /*
Save the data[3]
*/
exit /* Always end a do-file with “exit” */
Save the
do-file as read1.do
In the Stata
command window type
do
read1
To see the
output check the log file log1.log using notepad, wordpad, word or in Stata go
to File-Log-View
Lets try
with data from
excel (in *.csv format)
DO-FILE:
read2.do
capture log
close
/* In case no log is open */
log
using log2.log, append /* Start a log, you can
append or replace an existing log */
clear /* Reset memory, remove
active data */
insheet using
"H:\statadata\Testdata03.csv"
/* Read *.csv data */
describe /* Get general info on your
data */
save Testdata03,
replace /* Save the data[4] */
exit /* Always end a do-file with “exit” */
Save the
do-file as read2.do
In the Stata
command window type
do
read2
When the output
does not fit the screen Stata will make a pause waiting for you to press
“enter” (or any keyword) to continue. This is nice but sometimes is annoying,
Lets modify read2.do as follows.
DO-FILE:
read2.do [modified]
set more off /* New. */
capture log
close
/* In case no log is open */
log
using log2.log, append /* Start a log, you can
append or replace an existing log[5] */
clear /* Reset memory, remove
active data */
insheet using
"H:\statadata\Testdata03.csv" /* Read *.csv data */
describe /* Get general info on
your data */
save
Testdata03, replace /* Save the data[6] */
set more
on /* New */
exit /* Always end a do-file with “exit” */
In the Stata
command window type
do
read2
To see the
output check the log file log2.log using notepad, wordpad,
word or in Stata go to File-Log-View
Let’s
say you are only
interested in few variables
|
Var3 |
Population |
|
Var4 |
Imports |
|
Var5 |
Exports |
Will modify
the do-file as follows
DO-FILE:
read2.do [version 2.0]
set
more off
capture log
close /* In case no log is open */
log using
log2.log, append /* Start a log, you can append or replace an
existing log[7]
*/
clear /*
Reset memory, remove active data */
insheet using
"H:\statadata\Testdata03.csv" /* Read *.csv data */
keep var3 var4 var5
/* Keep the vars you need[8] */
describe /*
Get general info on your data */
save
Testdata03, replace /* Save the data[9] */
set more on
exit /* Always end a do-file with “exit” */
NOTE: YOU MAY
HAVE TO RETYPE THE SINGLE AND DOUBLE QUOTES WHEN COPYING THE DO-FILES CODES INTO
STATA
Save the
do-file and in the Stata command window type
do
read2
Let’s
say you have several
datasets in *.csv or *.dat format and want to do the
following:
- Create a log file for each
- Read the file
- Describe the data
- Get some summaries
- Get a codebook for the dataset
- Save it in Stata format
Suppose you
have three files in *.csv format (click on the file name to download): file1.csv, file2.csv and file3.csv.
DO-FILE:
read3.do [generic]
clear
set
more off
capture log
close
log
using "H:\statadata\\`1'.log", replace
insheet using
"H:\statadata\\`1'.csv"
describe
summarize
codebook
save
H:\statadata\\`1', replace
set
more on
log
close
exit
Or if you want
to add the variable labels use this one
DO-FILE:
read3.do [with variable labels]
clear
set more off
capture log close
log using "H:\statadata\\`1'.log", replace
insheet using "H:\statadata\\`1'.csv"
capture label variable var1 “Area in Square Km”
capture label variable var2 “Area in Square Mi”
capture label variable var3 “Population”
capture label variable var4 “Imports”
capture label variable var5 “Exports”
capture label variable var6 “Type of regime”
capture label variable var7 “Books read per month”
capture label variable var8 “Newspaper readership per wk”
capture label variable var9 “TV per capita”
capture label variable var10 “GDP per capita”
capture label variable var11 “School Enrollment”
capture label variable var12 “Personal income”
describe
summarize
codebook
save H:\statadata\\`1', replace
set more on
log close
exit
Capture
before “label variable” makes the do-file more interactive and applicable to
any of the files without Stata yelling at you because it can’t find the variable.
Save this do-file as read3.do
Let’s convert
file1.csv by typing:
do
read3 file1
Let’s convert
file2.csv by typing:
do
read3 file2
Let’s convert
file3.csv by typing:
do
read3 file3
IMPORTANT: Remember to specify the path or to change the
working directory when running do-files or any command that refers to a
particular directory (like use), otherwise you will get the error message file not found.
You can see
the output (use notepad, wordpad or word) by looking
at file*.log in the directory "H:\statadata\”
With do-file read3.do
we did the following:
- Created a log for each file
- Read the file
- Added some variable names
(optional)[10]
- Described the data
- Got some summaries (if you need
percentiles write summarize,
detail)
- Got a codebook for the dataset
- Save it in Stata format
As an
exercise do the same thing using infile from a previous section.
What
makes this works is
the macro `1’ which Stata interprets as an argument. To understand it better let’s
do a math exercise by creating a do-file that converts Fahrenheit into Celsius
and vice versa. Go to the do-file editor in Stata and enter the following
commands.
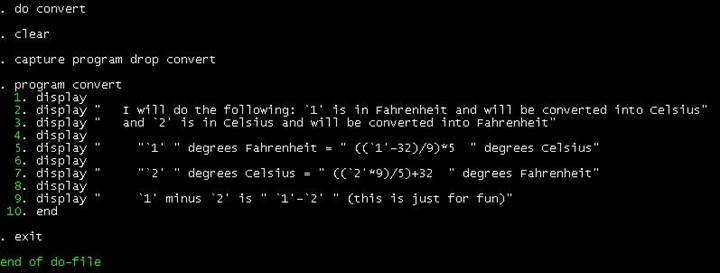
DO-FILE:
convert.do
clear
capture program drop convert
program convert
display
display " I will do the following: `1' is in Fahrenheit
and will be converted into Celsius"
display " and `2' is in Celsius and will be converted
into Fahrenheit"
display
display " "`1' " degrees Fahrenheit =
" ((`1'-32)/9)*5 " degrees
Celsius"
display
display " "`2' " degrees Celsius = " ((`2'*9)/5)+32 " degrees Fahrenheit"
display
display " `1' minus `2' is " `1'-`2' "
(this is just for fun)"
end
exit
NOTE: YOU MAY
HAVE TO RETYPE THE SINGLE AND DOUBLE QUOTES WHEN COPYING THE DO-FILES CODES
INTO STATA
The formulas
are the standard formulas for temperature conversion. Pay attention to the left
(in a standard keyword should be right below the ‘esc’ key) and right (next to
the ‘enter’ key) apostrophes in 1 and 2, this is how Stata identifies the
macros (for individual arguments) from regular numbers. Text is enclosed in
double quotations. Save the do-file as convert.do. Run it as:
do
convert
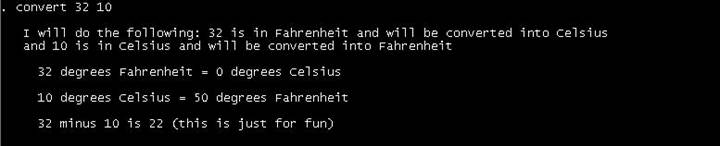
Now run the
program
convert 32
10
Sometimes we
need to perform the same task more than once. Let’s use the Stata file cnvselect.dta (you created this in a previous section, see
also do-file read3.do) to practice repetitions.
Let’s first rename some of the variables for easy identification. To rename
variables we type the following:
rename var1 areami
This is rename [oldname] [newname]
Do this for
the following:
rename var1 areami
rename var2 areakm
rename var3 population
rename var4 imports
rename var5 exports
rename var6 regime
We need to
add value labels to regime (because it is a categorical
variable). You need two commands: label
define and label value.
Defining
regime labels
label define regimelab 1
"Civilian" 2 "Military/civilian" 3 "Military" 4
"Other"
Assigning regime labels
label value regime regimelab
If you run a
frequency on regime (type tab
regime), let’s assume you
will se a number “9”. We will treat this is as
missing (and will be added to other missing data for this variable), to replace
“9” with missing we use replace:
replace regime=. if regime==9
Note “=” and
“==”. The “=” assigns a value, the “==” represents conditional, not assignment.
The “=.” means “equal to missing”. Run the frequency again and the “9” will be
gone. If you want to see the number of missing using tab type the following:
tab regime, missing
If you want
to know the average imports by type of regime type
tab regime, summarize(imports)
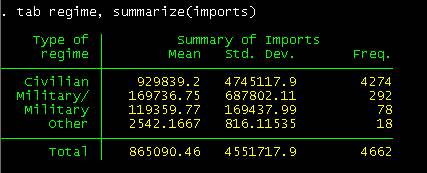
A civilian
government imports, on average, more than a military one.
Let’s
write a program to
calculate the z-value for some variables. Remember that the z-value represents
a distribution with mean 0 and standard deviation of 1. The formula is:
Z = (X – Mean
of X)/Standard deviation of X.
A
nice Stata feature are
the return values (type help return for
further details). Some Stata commands return results in r(). For example, type summarize imports
and return list as follows:
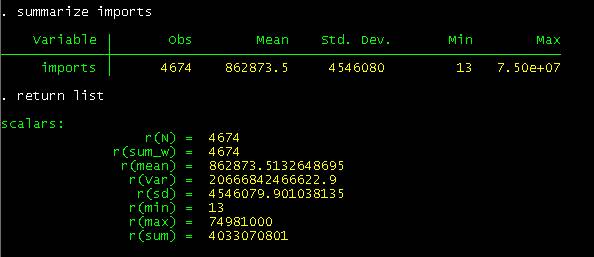
All
statistics from the summarize command are saved temporarily in r()
until the next command is called.
To get a
Z-distribution for variable “imports” we can use the return values from the
summarize command. We will use the generate command to create a new variable with
mean 0 and standard deviation 1. We do this right after running the summarize command for the variable “imports”.
generate imports_z=(imports-r(mean))/r(sd)
Another way
to do this is to use egen
egen imports_z=std(imports)
/*Here is a do-file to create z-scores from all variables in the
dataset*/
ds
local c `r(varlist)'
foreach var of varlist `c' {
egen std`var'=std(`var')
}
NOTE: YOU MAY
HAVE TO RETYPE THE SINGLE AND DOUBLE QUOTES WHEN COPYING THE DO-FILES CODES
INTO STATA
type help
egen
for more details.
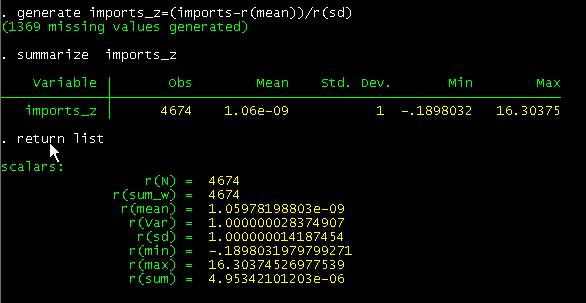
Results are
pretty much close to mean=0 and sd=1.
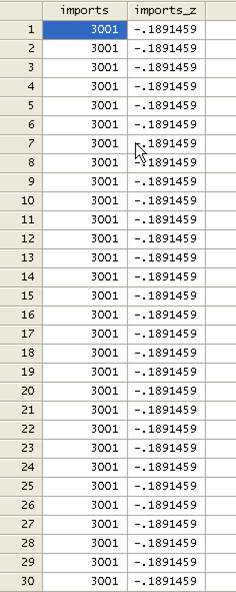
Type,
browse imports imports_z
You will see the original variable
and its z-value side-by-side
To close
the browser click on the “x” in the upper-right corner of the window.
But hold on! Your dataset have data for countries
across time. So we might need to do z-values by country rather than by the
whole sample. Imagine that we need to create z-distributions of more than one
variable for a lot of countries. Let’s try it.
This is a bit trickier. Let’s
explore the “country” variable first, type tab country.
“Country” is a string variable with the names of the countries in the dataset.
We need to put this into numeric by recoding 1 = country A, 2 = B, 3 = C, etc.
Fortunately, Stata has a nice
little command called encode (type help
encode for details):
encode country,
generate(country1)
This is
Econde [var with strings], generate(new variable with numeric coding)
Now type
tab country1
No difference with “country”, try
this one:
tab country1,
nolabel
Now we have a numeric variable for
a total of 37 countries (whether there are some
duplicates or not that does not matter right now).
[IMPORTANT:
we will treat years within countries as cases (they could be firms, cases,
families, individuals, etc), in reality it may not
make much sense to create z-values from time series, we are using this dataset
to show how commands work]
Let’s say you need to generate z-distributions for three
variables and 37 countries, furthermore, you need to graph the z-distributions
for each country.
- To generate the z-distributions we will use foreach and,
- To generate the graphs we will use forvalues (type
help foreach and help forvalues for
more details on these commands)
Let’s do the z-values first and
the graphs later.
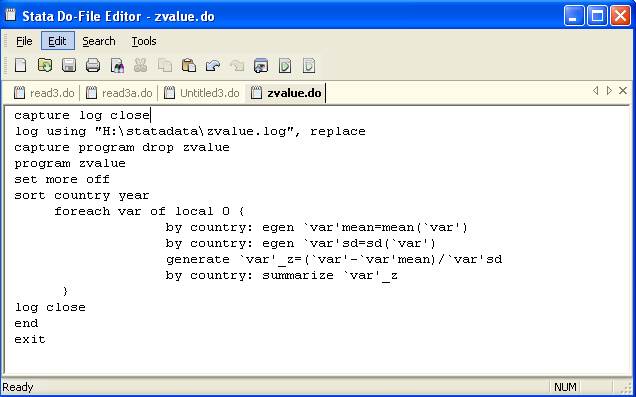
DO-FILE:
zvalue.do
capture log
close
log
using "H:\statadata\zvalue.log", replace
capture
program drop zvalue
program zvalue
set
more off
sort
country year
foreach
var of local 0 {
by
country: egen `var'mean=mean(`var')
by
country: egen `var'sd=sd(`var')
generate
`var'_z=(`var'-`var'mean)/`var'sd
by
country: summarize `var'_z
}
log
close
end
exit
NOTE: YOU MAY
HAVE TO RETYPE THE SINGLE AND DOUBLE QUOTES WHEN COPYING THE DO-FILES CODES
INTO STATA
Do-file zvalue.do
introduces some new commands: foreach, egen,
local 0. Foreach helps you
to loop over a list of variables, egen generates ‘analytical’ variables (like means,
standard deviations, counts, sums, etc.), local 0 is a macro that stores
lists (unlike local 1, 2, 3, which store argument 1, 2 or 3, local 0 stores
argument 1 and 2 and 3). Notice the ‘by’, it helps you to run the command by
any group in your data (country in this case). The do-file editor will look
like:
Make sure Stata is working in the
following directory
H:\statadata\
Save the do-file zvalue.do here.
From the command window in Stata type
do zvalue
You can also run the do-file from the
do-file editor by clicking on the right arrow
It will create the program “zvalue”. We want to create z-distributions for three
variables: population, imports and exports. To do this using
the zvalue program type the following:
zvalue population imports exports
The program will create 9 new variables with suffixes *mean, *sd
and *_z. The summaries for each country on the z-values are in the log file zvalue.log (which you
can check with any word processor). Pay attention to the left and right
apostrophe in “var”. The program will run three times
because we use three variables (we could have written “foreach var of population imports
exports {“) defined in local 0 (which makes
the program more interactive if we want to use some other variables)
Here are some other examples on how to use “foreach”
foreach var of varlist var1-var147 {
replace `var'=999 if `var'==.
sort `var'
gen id`var'=_n
replace id`var'=0 if id`var'>3
}
foreach var of varlist x2000-x2006 {
gen y`var'=`var'
}
Using levelsof
gen betax1=.
gen betax2=.
gen betax3=.
gen sex1=.
gen sex2=.
gen sex3=.
gen constant=.
gen seconstant=.
levelsof countries, local(x)
foreach nation of
local x {
reg y x1 x2 x3 if
countries==`nation’
replace
betax1=_b[x1] if countries==`nation’
replace
betax2=_b[x2] if countries==`nation’
replace betax3=_b[x3] if
countries==`nation’
replace
sex1=_se[x1] if countries==`nation’
replace
sex2=_se[x2] if countries==`nation’
replace
sex3=_se[x3] if countries==`nation’
replace
constant=_b[_cons] if countries==`nation’
replace seconstant=_se[_cons] if countries==`nation’
}
/*Missing
values in a variable
If you
have a big dataset with lots of variables, use this to delete variables with
lots of missing values.
You may
have to install ‘mdesc’ since it
is not a built-in Stata command.
Type “ssc install mdesc”. If this does not work type “findit mdesc” select a link and click on ‘install’.
Type
mdesc var /*Where ‘var’ is the
variable you want to check. */
|
Variable |
Missing |
Total |
Percent Missing |
|
var |
10 |
74 |
0.1351 |
The table
shows that ‘var’ has 10 missing observations out of 74
in total, representing 13.51%.
If you
type:
return list
You will
see the saved values
scalars:
r(percent)
= 0
r(total)
= 74
r(miss)
= 0
macros:
r(notmiss_vars) : "price"
The example below delete variables that have more
than 20% missing values, the cutoff is up to you*/
foreach var
of varlist var1-var200 {
set more off
mdesc
`var'
local
percent=r(percent)
if
`percent'>0.2 drop `var'
else
}
NOTE: YOU MAY
HAVE TO RETYPE THE SINGLE AND DOUBLE QUOTES WHEN COPYING THE DO-FILES CODES
INTO STATA
IMPORTANT: Type help foreach for more details. You can also type:
foreach var in … { /*Allows general lists not just variables,
useful with file names*/
foreach
var of local …{
/*Using local macros*/
foreach
var of global …{
/*Using global macros*/
foreach
num of numlist …
{ /*Allows numeric lists*/
Now that we have the z-values, we proceed to generate a
line graph for each z-value per country. We will use the following do-file
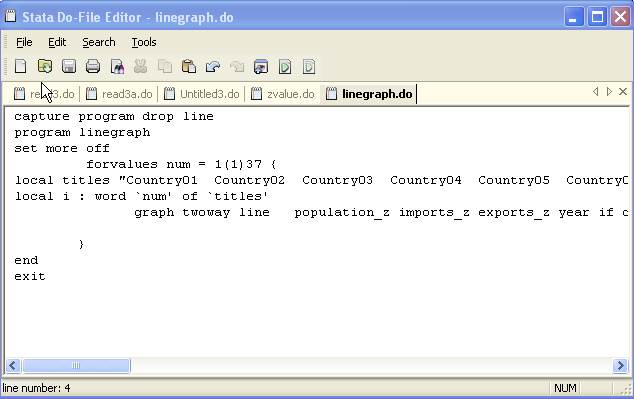
DO-FILE:
linegraph.do
capture
program drop line
program
linegraph
set
more off
forvalues
num = 1(1)37 {
local
titles " Country01 Country02
Country03 Country04 Country05
Country06 Country07
Country08 Country09 Country10
Country11 Country12 Country13
Country14 Country15
Country16 Country17 Country18
Country19 Country20 Country21 Country22 Country23
Country24 Country25 Country26
Country27 Country28
Country29 Country30 Country31
Country32 Country33 Country34
Country35 Country36 Country37"
local
i : word `num' of `titles'
graph twoway
line population_z
imports_z exports_z year if
country1==`num', legend( order(1
"Population" 2 "Imports" 3 "Exports") ) xtitle(Year) ytitle(Z-value)
title(country `num' `i')
subtitle(Z-values) lpattern(solid longdash
shortdash) lwidth(medthick medthick medthick) saving(`i',replace)
}
end
exit
NOTE: YOU MAY
HAVE TO RETYPE THE SINGLE AND DOUBLE QUOTES WHEN COPYING THE DO-FILES CODES
INTO STATA
Do-file line.do looks
rather long and scary but it does not really. Here we have the commands forvalues, graph twoway line, and two
macros (local titles and local i :)
Unlike foreach that
loops across variables, forvalues loops
across cases (in this case countries). The dataset has
37 countries so we need to generate 37 graphs. Forvalues num = 1(1)37 is defining a macro “num” (could
be anything) that will count 1 to 37 one by one (that is the one in
parenthesis, If you put 2 it will do 1, 3, 5, 7, etc).
Local titles defines the list of country names, here you have to
be sure that the seventh country will have a code number 7 (check the value
labels by typing labelbook country1).
Local i will synchronize the titles with the country number
and use it in the graph title and the graph name (when saving it), it will
basically say that since we are working, for example with country 7, take the seventh
name in the list and use it to name/save the graph.
Graph twoway
line is how Stata define line graphs
(type help graph for details on this and other types of graphs)
The do-file
editor looks like this
To run this
do-file type in Stata command window
do linegraph
To run the
program that makes the 37 graphs just type (and grab a cup of coffee or tea)
linegraph
You will see
graphs appearing and disappearing and your directory will be crowded with 37
graphs. Once it finishes check some of the graphs typing
graph use [country name]
or
graph use "H:\statadata\[country name].gph"
To verify country name and number, type
browse country if country1==[TYPE THE NUMBER OF THE COUNTRY YOU WANT
TO CHECK]
The browse
window will appear with the column of country name you called, for example
browse country if country1==23
You can do
the same in case you need to run 50 regressions or do some additional
transformation.
Here is another example on how to use “forvalues”
forvalues var = 1(1)147 {
gen file`var’=.
forvalues
x = 148(1)5000 {
if
abs(age[`var’]-age[`x'])<=6 {
if abs(date[`var’]-date[`x'])<=365
{
if
((income[`var’]-income[`x']))==0 {
if
((turn[`var’]-turn[`x']))==0 {
replace file`var’
=((a[`var’]-a[`x'])/b)^2+((c[`var’]-c[`x'])/d)^2
in `x' if file`var’==.
}
}
}
}
}
}
NOTE: YOU MAY
HAVE TO RETYPE THE SINGLE AND DOUBLE QUOTES WHEN COPYING THE DO-FILES CODES
INTO STATA
/* The following is a procedure was taken
from Stock & Watson’s companion materials to their book Introduction to
Econometrics*/
/* In the example, monthly time series*/
tsset
time
gen diffvar1 = d.var
local i = 60
gen q1 = .
gen q5 = .
while `i'<=(204)
{
gen di = (_n >
`i')
cap gen d_var1 =
di* var [_n-1]
cap gen d_var2 =
di* var [_n-2]
cap gen d_var3 =
di* var [_n-3]
cap gen d_var4 =
di* var [_n-4]
qui reg diffvar1 L(1/4).diffvar1 di if tin(1992m12,2007m12), r
qui test di
sca
chow1 = r(F)
cap replace q1 =
r(F) in `i'
qui reg diffvar1 L(1/4).diffvar1 di d_var1 d_var2 d_var3 d_var4
if tin(1992m12,2007m12), r
qui test di d_var1
d_var2 d_var3 d_var4
sca
chow5 = r(F)
cap replace q5 =
r(F) in `i'
dis "`i' " %tm
time[`i'] "
" %8.3f chow1 " "
%8.3f chow5
drop di d_var1
d_var2 d_var3 d_var4
local i = `i' + 1
}
tsline
q5
For a
comprehensive list of Stata commands you should know check the following site (some
may or may not work in Stata 10)
http://www.ats.ucla.edu/stat/stata/notes2/commands.htm