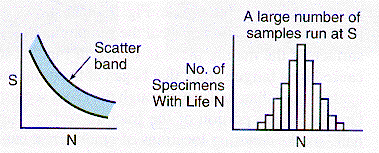
The diagram below shows the form of an S-N curve (a), and the nature of the distribution of cycles to failure at a given load. In designing for fatigue resistance, the lowest life at a given stress state is the best guide.
The fatigue cracks in this type of experiment are observed to start at the sample surface, the region of maximum tensile stress in each cycle. Sample surface condition is very important in determining the fatigue life, and surface flaws such as corrosion pits or mechanical damage reduce the fatigue life by increasing the local stress in that region of the surface.

From: McMahon and Graham, :"The Bicycle and the Walkman," Merion (1992)
When selecting a material
for spoke use, it may be better to chose one that has a lower
S-N curve
but is more corrosion resistant. In this way the fatigue life will be more
predictable as failures due to local corrosion cracks will be removed.
| Materials |
| Menu |
| Prev |
| Next |