| |
|
These
two diagrams illustrate the major components of water resistance to a boat,
with the numbers relevant to the trireme replica. Wind resistance is ignored.
The
blue graph corresponds to the power required to overcome the skin-friction
drag between the wetted area of the hull and the water. This increases
approximately as the square of the boat speed.
The red graph is
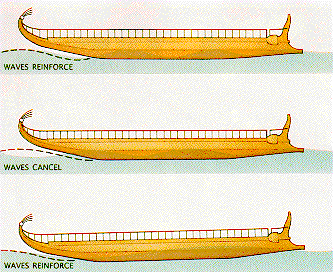
associated with wave-making by the boat. A standing wave (attached to the
boat) is formed at the bow and has a boat velocity dependent wavelength. The
wavelength increases with the boat speed and a special condition - the hull
speed - is reached when half the wavelength of the bow wave is equal to the boat
length. In this critical speed condition the bow wave and the stern wave
add in phase and the wave-making resistance increases rapidly.
The 7
knot cruising speed of the trireme is dominated by energy loss to friction drag. |
|
|
 |

