| |
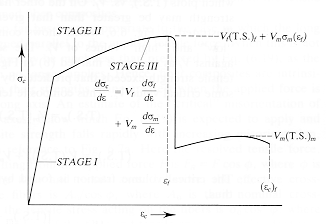
The tensile
behavior of composites is also different from that of metals in the 'plastic
deformation' region of the stress/strain curve. The diagram shows the
curve for a uniaxial sample tested along the fiber direction. For this material
the strain at fracture is less for the fibers than for the matrix, and the
fiber's Young's modulus is larger for than that of the matrix.
In
Stage I both the fibers and the matrix are in their elastic range. The sharp
break as Stage II is reached is due to the matrix becoming plastic. The
effective elastic modulus of the matrix then drops to the local slope of the
matrix stress/strain curve, (dsM
/ de).
At the
peak of Stage II the fiber fractures and the full load is transferred to the
matrix. For the material illustrated, the volume fraction of the ductile
matrix is large enough that it can take the increased load without failing.
The composite continues to deform along the matrix stress/strain curve until
matrix fracture occurs which causes the final composite failure. The area under
the total curve is a measure of the toughness of the composite |
|
|
|
|
|
|
|
|
|
|
|
|