| |
Newton's
laws will govern the movement of human powered vehicles. Quantities such
as their position, speed, and acceleration will be important in evaluating their
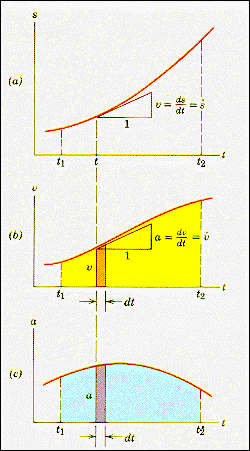
performance. The diagram opposite represents how these quantities might
behave as a function of time for a vehicle moving in a straight line. To keep
things simple, the vehicle will be thought of as a point mass, m.
Curve
(a) shows the position of the mass as a function of time. The slope, (Ds/Dt), at any given
time gives the average velocity over the time interval Dt. The velocity is defined as the value of this slope
in the limit of the time interval going to zero: v = (ds/dt).
Plotting the velocity from
(a) as a function of time gives the (b) curve. The slope of this curve at
any given time is the acceleration of the mass at that time: a = (dv/dt) = (d2s/dt2).
The area under the velocity time curve is the total distance travelled:
(s2 - s1)
Curve (c) is a plot of the acceleration
as a function of time. The area under this curve between t1
and t2 is the change in velocity over this time period: (v2
- v1)
|
|
|
|
|
|
|
|
|
|
|
