|
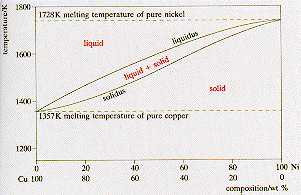
A
phase diagram shows the range of existence of phases in materials with
more than one component. The binary phase diagram shown for the copper-nickel
alloy indicates that these materials can form both liquid and solid solutions
over the full range of composition from Cu to Ni. Above 1728 K, the melting
point of pure Ni the alloys ar in the liquid phase. Between 1728 K and
1357 K (the melting point of Cu) the alloys can be either solid or liquid
or exist as two phases in equilibrium. Below 1357 K all the alloy systems
are solids. The liquidus and solidus lines delimit the two phase zone.
In this region at a given temperature, the compositions of the solid and
liquid present in thermodynamic equilibrium are given by the composition
at the point of intersection of the isotherm with the solidus and liquidus
lines respectively. |
|
|
