| Econ. 153a |
Fall 1996
|
C. Sims |
Overlapping Generations Exercise
- Calibrate our overlapping generations model as follows.
Choose
 to make
  match the ratio of labor income to gross output (GDP) in the US, taking
some kind of average over 1950-96 (or a shorter period if that's necessary
because of data limitations). You should be able to find this from the
national income and product accounts. Choose as
match the ratio of labor income to gross output (GDP) in the US, taking
some kind of average over 1950-96 (or a shorter period if that's necessary
because of data limitations). You should be able to find this from the
national income and product accounts. Choose as  .
Choose
.
Choose  (7% per year, converted
to a 30-year rate). Choose 1+n to match the population growth rate
over 1900-90, converted to a 30-year rate.
(7% per year, converted
to a 30-year rate). Choose 1+n to match the population growth rate
over 1900-90, converted to a 30-year rate.
- Find the implied steady state interest rate. (Note that
the steady-state interest rate does not depend on A.) Is it a reasonable
value? Check it against the average postwar US real interest rate, measured
as the average nominal interest rate minus the average inflation rate.
(This would be something like
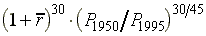 ,
where the P's are values of the GDP deflator and
,
where the P's are values of the GDP deflator and  is an average of nominal interest rates quoted at the usual annual rate.)
- Suppose this economy was at its steady state in 1920,
but that the changes in population size given by the numbers born in 1920,
1950, and 1980 constituted a pattern of deviations from the trend path
of population for three "generations". Calculate how the relative
per capita wages and utilities of the generations born at these three dates
would vary. Assume the number in the 2010 generation return to the trend
growth rate.
To do this exercise, you need to find data. Any source
can be used. The Department of Commerce publishes the National Income and
Product Accounts in the Survey of Current Business, which you should
be able to find in the library. Probably all the data you need are available
on the net at FRED, the Federal
Reserve Bank of St. Louis data page and at the Bureau
of the Census web site (http://www.census.gov/) for population.