Next: PROPERTY LOADS CENTRIFU [lname] [lnumb] part Up: PROPERTY LOADS Previous: PROPERTY LOADS
![]()
![]()
![]()
![]()
![]()
Next: PROPERTY LOADS CENTRIFU [lname] [lnumb] part
Up: PROPERTY LOADS
Previous: PROPERTY LOADS
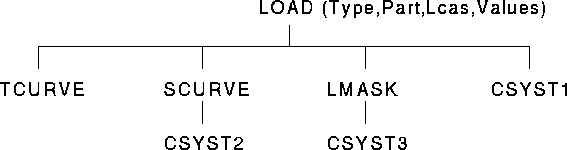
| TCURVE | = | time curve definition (see CONSTRUCT TCURVE) |
| SCURVE | = | space curve definition (see CONSTRUCT SCURVE) |
| LMASK | = | load mask definition (see CONSTRUCT LMASK) |
| CSYSTn | = | local coordinate system definition (see CONSTRUCT COORDSYS) |
Examples:
This is a simple load definition to which more complex data will be defined and attached in the following examples.
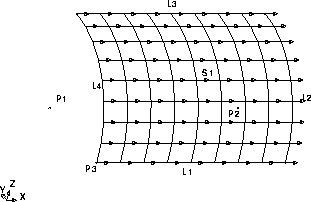
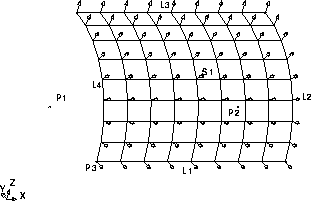
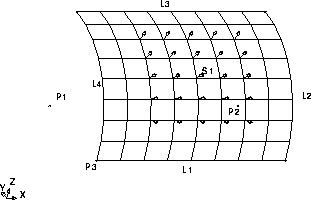
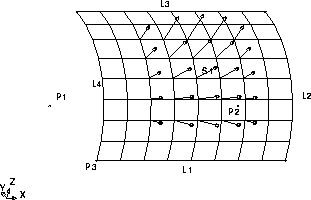
Local Coordinate systems are used to modify the direction of a load and are thus usually reserved for nodal vector loads. A typical application would be to specify a radial load on a circular part by the application of a local cylindrical coordinate system.
Load Masks are used to limit the extent of a load. Load Masks may be defined either in terms of parametric (0-1) distances on the loaded part's geometry or in terms of the global coordinate system. It is possible to append a local coordinate system to a load mask defined in the global coordinate system. A typical application might be the definition of the water line on a ship model.
Space curves are used to describe the variation of a load in space and consist of a number of locations and associated values by which the basic load is multiplied. Space curves may be defined either in terms of parametric (0-1) distances on the loaded part's geometry or in terms of the global coordinate system. It is possible to append a local coordinate system to a space curve defined in the global coordinate system. A typical application would be the radial variation of a load on a circular geomery.
Time curves are used to describe the variation of a load with time and are usually applicable only to dynamic analyses. The Time Curve is a list of times and amplitude values by which the basic load is multiplied. Example applications might be the magnitude of a pressure pulse from an explosion or the variation in film coefficients and temperatures on the boundary of a transient heat transfer analysis.
Femsys Limited