|
|
|
||||||||||||
Phase Diagrams |
||||||||||||||
Binary
Phase Diagrams · Binary phase
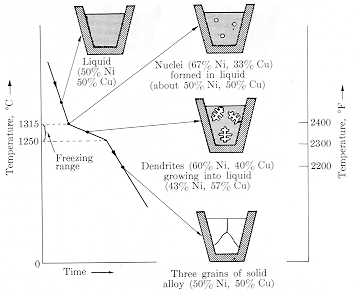
diagrams may be obtained from cooling curves for alloys. |
||||||||||||||
· Pure materials have unique
melting points, but alloys melt over a range of temperatures. |
||||||||||||||
 |
||||||||||||||
From: Guy & Hren, "Elements of Physical Metallurgy," Addison Wesley (1974) |
||||||||||||||