Campus seismometers illustrate compliance with the stay-at-home order
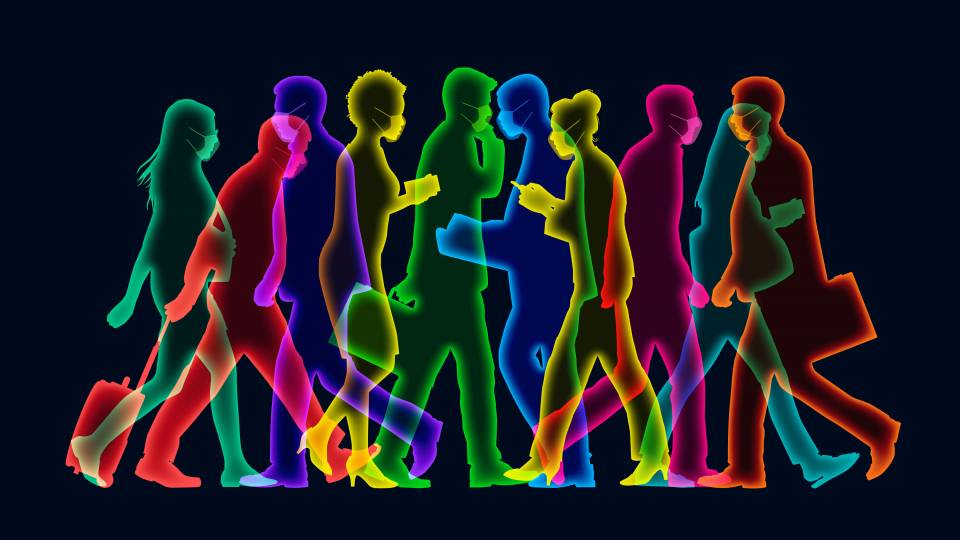
Princeton byways have emptied out since the governor’s stay-at-home order on March 21. This image composite merges popular University throughways as they appeared on a typical pre-pandemic fall day (left) compared to the present (right).
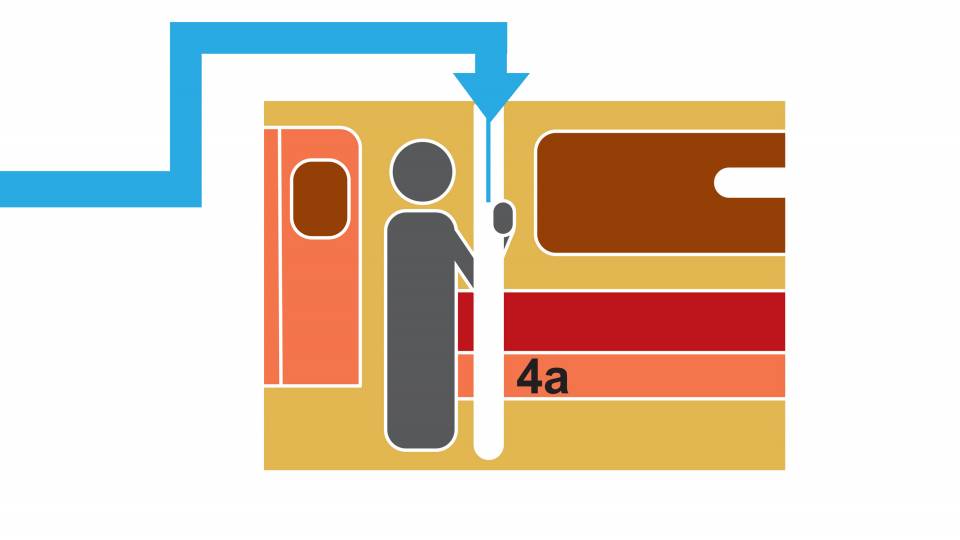
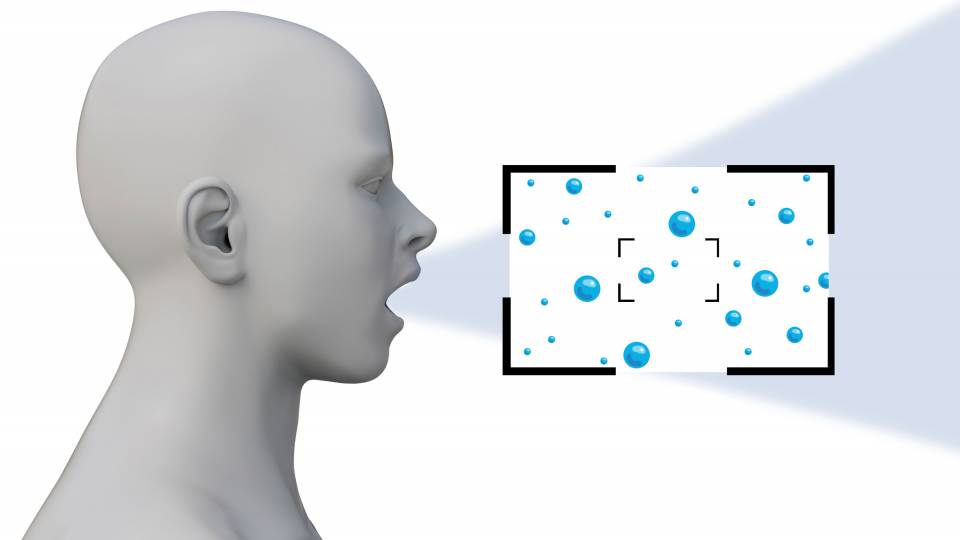
Most people only hear about seismometers in the context of big earthquakes or volcanoes, but the sensitive instruments detect much gentler movements as well.
This shows four and a half months of high-frequency seismic noise — detected by a seismometer in Princeton’s Guyot Hall — as illustrated on a 24-hour clock. Each circle is like a tree ring, with the oldest data (February 5) in the middle and the most recent data (June 21) at the outer edge. Dark blue is seismically quiet, bright yellow shows heavy motion, and shades of green are in between. Two narrow white rings show the cessation of on-campus instruction on March 13 (marked with the blue dot) and the governor’s stay-at-home order on March 21 (orange dot). Prior to those, the area around Guyot recorded lots of movement (bright yellow) from about 7 a.m. (7 h) till 5 pm (17 h). The evening and overnight hours were quieter but still show some activity. After the stay-at-home order, the overnight hours went even quieter (darker blues) and the daylight hours show a stark decline in activity level.
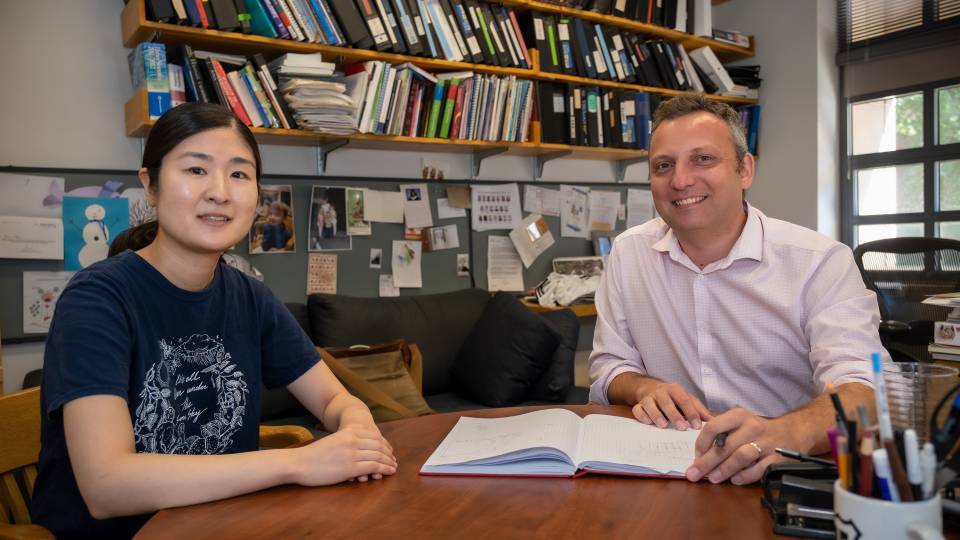
“They can pick up people moving, or public transportation,” said Yuri Tamama of the Class of 2022, who is analyzing data from campus seismometers as part of her internship with the Princeton Environmental Institute. “Before this project, I never expected some waves and wiggles on a seismogram to show so much information about the environment.”
In recent months, seismometers have seen a sharp decline in the level of background noise as human activity has been curtailed in response to COVID-19. The seismograms recorded in the basement of Guyot Hall reveal the decline in local seismic noise, first after the end of on-campus instruction on March 13, and then a more dramatic decrease after Governor Murphy’s stay-at-home order on March 21.
“The noise level had been high and then just went off a cliff,” said Dr. Jessica Irving, a visiting research collaborator in geosciences who is one of Tamama’s advisers. “There was a small change in noise levels over Spring Break, but when we were told, ‘Don't come to campus, it's not good for safety,’ people just stopped.”
Similar patterns have appeared in other data sets, from traffic cameras to cellphone movements, but seismicity can provide useful information without compromising privacy.
Tamama’s project this summer is comparing the seismic record from spring 2020 with that of previous years, working with Irving and Frederik Simons, a professor of geosciences. She is still compiling the data, but she expects the difference will be stark. She is also looking forward to seeing what other patterns emerge. “The abundance of knowledge that can be gleaned from seismology is so interesting,” she said.
Irving is part of an international collaboration tracking seismic background data — and its implications for coronavirus response — around the globe. “I've never published a paper that involves human behavior before,” she said with a laugh. (Her usual subject is the Earth’s deep interior, using seismic data to study the core and mantle.) “This is a very different flavor of science, but it's the same data, it's just it's telling a different story,” said Irving, who is now a senior lecturer at the University of Bristol.
“It seems like ‘Team Princeton’ is really working hard to try and reduce transmission, and so that's what we see right now in the data,” Irving said. “Maybe the virus would have been worse in New Jersey, if not for the behavior that we saw.”
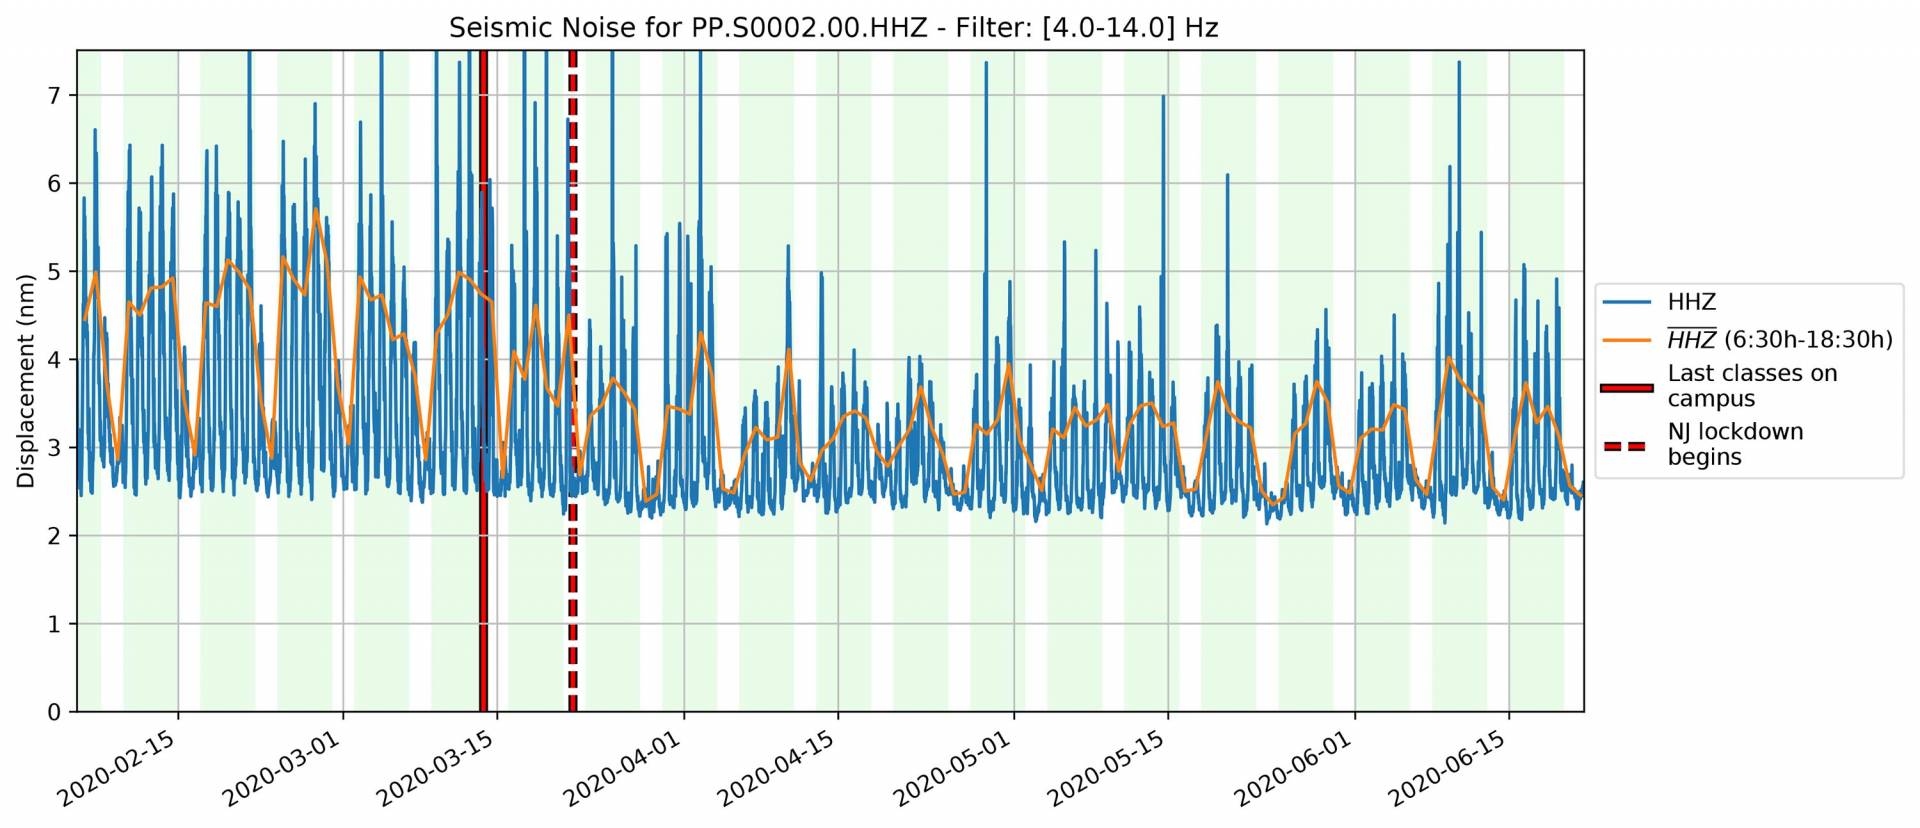
This seismogram shows high-frequency "background" seismic activity from early February (left) till late June (right). The solid red line shows March 13, when on-campus instruction ended at the University; the dashed red line is March 21, when the stay-at-home order was issued. The orange line represents the average noise in daytime hours. The difference between the pre-shutdown and post-shutdown seismicity reflects how many fewer people and vehicles were moving around as people limited their movements in response to the pandemic.